ブーストしようとしています:

おかぁーさーん!!DALL E 3ちゃんが、prompt一発で、おしゃれなグラフを描いた!
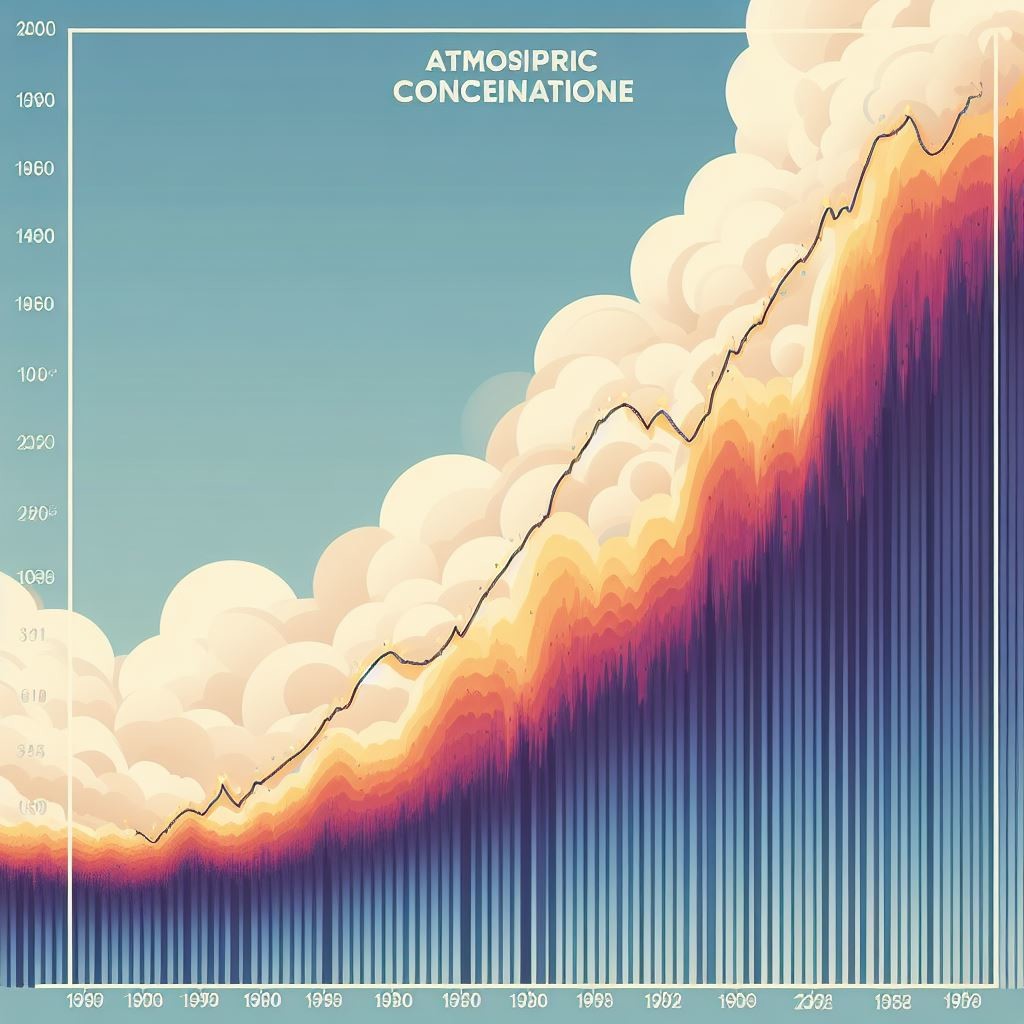
Atmospheric CO2 Concentration: 1963-2023 This chart illustrates the steady increase in atmospheric carbon dioxide levels over the past six decades., X-axis: Year, Y-axis: CO2 Numbers
おかぁーさーん!!DALL E 3ちゃんが、prompt一発で、おしゃれなグラフを描いた!
Atmospheric CO2 Concentration: 1963-2023 This chart illustrates the steady increase in atmospheric carbon dioxide levels over the past six decades., X-axis: Year, Y-axis: CO2 Numbers